Sievant docs
Audit and dashboard
The audit trail every call leaves, and the embedded dashboard that shows it.
Audit
Every tools/call, prompts/get and resources/read produces an audit
record (kind tool, prompt or resource), and so does every security event. Auditing never delays a response: the record is submitted after
the response has been written.
Overflow. Records reach the store through two bounded queues of
audit.buffer_size each. Security records (every event and summary:
denials, credential and PII blocks, constraint violations, SSRF and path
escapes, authentication failures, header mismatches, row and bytes budgets,
refused responses, output redactions) have their own queue, which the
writer serves first; they are never dropped to make room for call records.
If the writer itself stalls (a slow or failing disk) a security record
waits up to 5 s for room, holding its worker (not the response); one that
still finds none, or whose batch fails to commit, is written to the log in
full at ERROR (it holds no raw input) and counted in
sievant_audit_security_dropped_records_total. Call records are the
only records that drop. audit.on_overflow chooses what a full call queue
means:
drop(default): the call runs; its record is dropped and counted insievant_audit_dropped_records_total(which also counts the security records above).strict: a place in the call queue is reserved just before the tool runs; if there is none the call is answered BUSY (-31002, “the audit queue is full”) and never reaches the backend. No call runs unaudited.
The writer’s priority means record ids follow commit order, not strictly submission order: an event can have a lower id than the call record submitted just before it.
What a record holds. trace_id, ts, agent_id, tool, the
sanitized input (never the raw input), raw_input_hmac (keyed
HMAC-SHA256 of the raw input) with hmac_key_id, the input
redaction_spans, status, policy_action, duration_us, bytes_in and
bytes_out (the JSON-RPC request and response as sent), and
est_tokens_in / est_tokens_out. Token counts are estimates
(bytes / 4, not a tokenizer); every column, field and metric that carries
them says so. The raw input is the tool or prompt arguments JSON as sent,
or the resource URI (whose sanitized copy is stored as {"uri": ...}).
Every record of a request with input carries its HMAC, including denials,
constraint violations and calls refused before sanitization, so an attempt
can be verified against the raw input later (VerifyInput). Requests
stopped before the sanitize_input stage are sanitized for the audit record
only when the record is written in full: a flood-suppressed denial costs an
HMAC, not a sanitization pass. Agent-chosen strings that are not catalog names (unknown tool
names, resource URIs, request IDs) go through the redaction engine and are
cut to 256 bytes before they are stored.
Security events are audit records too (record_type = 'event', the
kind in policy_action):
| policy_action | rule | also |
|---|---|---|
POLICY_DENIED |
the Policy.Decide code (no_policy, deny_rule, no_allow_rule) or unknown_name |
reason (Decide’s reason), policy_revision |
ARG_CONSTRAINT_VIOLATION |
the argument name | reason, policy_revision |
CREDENTIAL_BLOCKED / PII_BLOCKED |
the redaction rule | sanitized input and HMAC |
ROW_BUDGET_EXHAUSTED |
refused or truncated |
reason (retry time, or rows returned of rows) |
OUTPUT_REDACTED |
the redaction rule | redaction_count |
AUTH_FAILURE |
the reason class (kind auth; tool is the endpoint, mcp or dashboard) |
client_addr: the peer, or the address a trusted proxy forwarded; the presented credential is never recorded; flood-limited per address |
HEADER_MISMATCH |
the header name (kind protocol) |
reason: missing, mismatch, invalid, repeated, unexpected or credential; header values are never recorded |
An event that stopped the call (a denial, a block, a refusal) is that
call’s only record. Truncations and output redactions are extra records
next to the call record, with the same trace_id and request_id.
Flood protection. Per (agent, kind, name) and audit.flood.window
(default 1m), the first audit.flood.full_records (default 10) events are
full records. At the end of the window a key that had more gets one
summary record whose event_count is the key’s total for the window,
full records included, so the summaries of a flooded key add up to every
event it had. Tracked keys are capped (names are attacker-chosen); beyond
the cap, events are summarized per (agent, kind) as (untracked names).
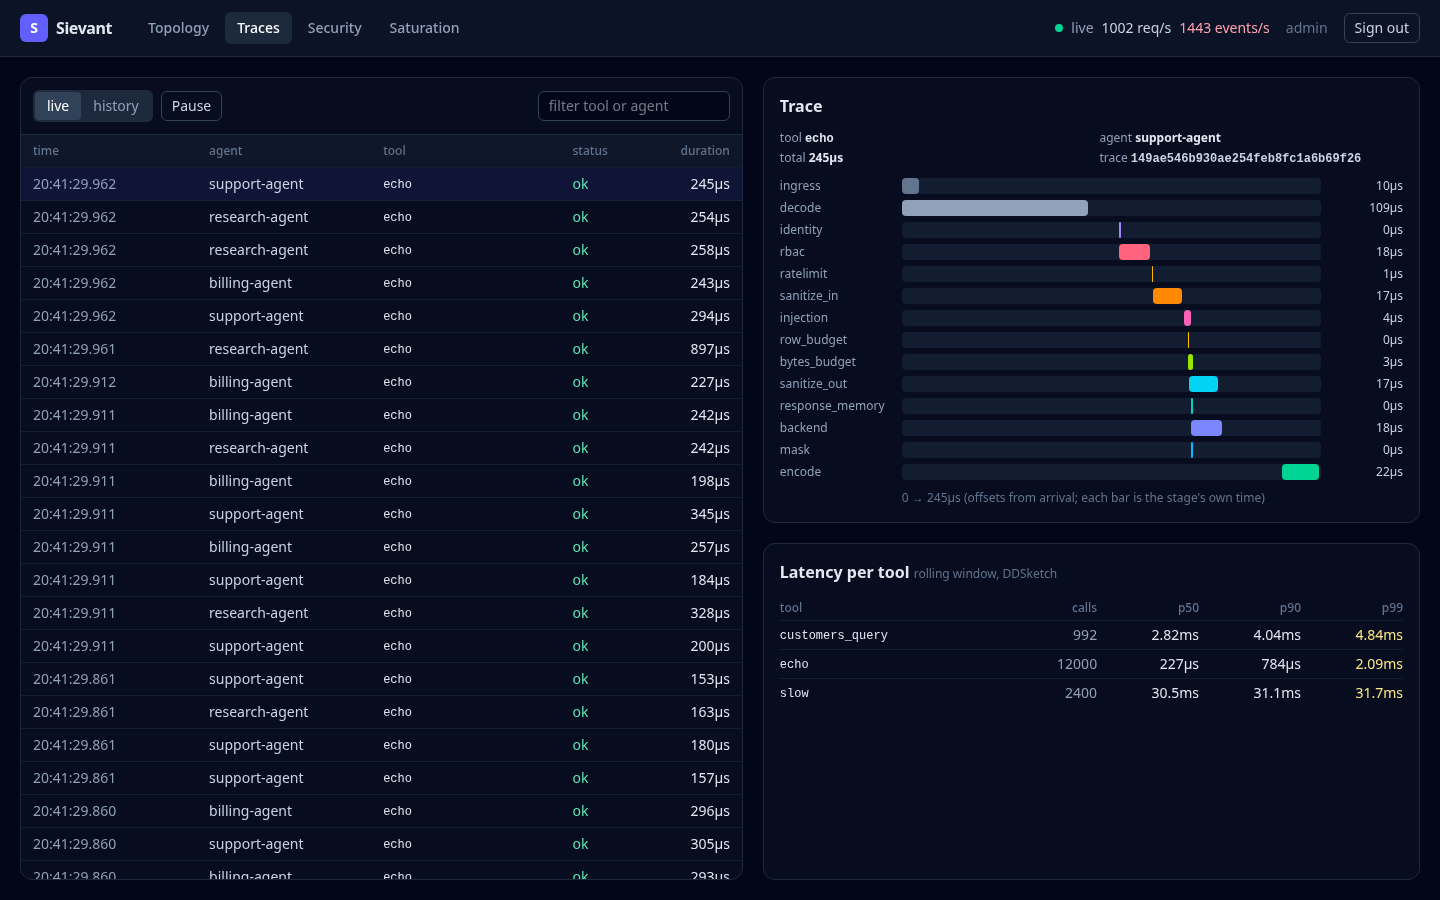
Traces. Each call record stores its stages as one JSON array in its
spans column ([{"stage":…,"start_us":…,"dur_us":…}]; schema version 3
moved them there from a trace_spans table with a row per stage, which
cost about twelve inserts per call):
ingress (hand-off from the reader plus any wait for a worker), decode,
identity, rbac, ratelimit, sanitize_in, row_budget,
bytes_budget (each budget passes the other kind of tool straight
through), response_memory, backend,
mask (the output_budget stage: masks and the size budget),
sanitize_out, encode. prompts/get and resources/read records have
ingress, decode, rbac (authorization and rate limit), backend and
encode. start_us is the offset from the record’s ts;
dur_us is the stage’s own time, excluding the stages it called.
Store. audit.sink: local is a SQLite database (modernc, pure Go) in
WAL mode with mmap_size 64 MiB. The file is created with mode 0600 (a
more permissive existing file is tightened, with a WARN), and SQLite gives
its -wal and -shm files the same mode. One writer goroutine commits
every batch_size records or flush_interval, whichever is first. The
schema is versioned (schema_migrations); a database from a newer build is
refused. Records older than retention (default 720h, 30 days) are deleted
every purge_interval, in bounded chunks.
HMAC keys. Each record stores the ID of the key that produced its
HMAC. To rotate, move from hmac_key (key ID default) to a keyring, add
the new key and make it active; keep old keys for as long as their records
must stay verifiable:
sanitization:
  hmac_keys:
    - id: k2026b
      key: ${SIEVANT_HMAC_KEY}
    - id: default            # the former hmac_key
      key: ${SIEVANT_HMAC_KEY_OLD}
  hmac_active_key: k2026b
Query API. audit.QueryAPI (implemented by *audit.Auditor) is the
internal interface: Records(ctx, Filter) (time range, agent, tool,
status, type, action; keyset paging by id), Spans(ctx, id),
VerifyInput(ctx, id, raw) (recomputes the HMAC with the record’s key) and
Latencies(). Queries run on read-only connections and get a 10s deadline
when the caller’s context has none. HTTP exposure comes later.
Latency quantiles. p50/p90/p99 per tool over a rolling six-minute
window (one-minute slots), using DDSketch from
github.com/DataDog/sketches-go (pure Go, Apache-2.0) with 1% relative
accuracy and bounded bins. Calls stopped by a security event are not
counted.
Metrics. metrics.listen_addr (unset: no listener) serves Prometheus
GET /metrics (github.com/prometheus/client_golang; measured against
github.com/VictoriaMetrics/metrics with the same families and labels, it
cost about 0.4 MB more idle RSS and 0.7 MB more binary, too little to
switch). It is
unauthenticated; a non-loopback address is logged at WARN. Labels only ever
hold catalog tool names (unknown otherwise), configured rule IDs and
fixed reason codes.
| Metric | Labels |
|---|---|
sievant_tool_calls_total |
tool, status |
sievant_primitive_requests_total (prompts/get, resources/read) |
kind, status |
sievant_policy_denials_total |
kind, reason |
sievant_credential_blocks_total, sievant_pii_blocks_total |
rule |
sievant_row_budget_exhausted_total, sievant_bytes_budget_exhausted_total |
tool, outcome |
sievant_ssrf_blocked_total |
reason |
sievant_response_memory_reserved_bytes (gauge) |
|
sievant_upstream_responses_refused_total |
tool, reason (max_response_bytes, content_type, response_schema) |
sievant_redactions_total |
direction (input, output), rule |
sievant_estimated_tokens_total |
direction |
sievant_tool_call_duration_seconds (summary: rolling quantiles, lifetime count and sum) |
tool |
sievant_audit_dropped_records_total, sievant_audit_security_dropped_records_total, sievant_audit_written_records_total, sievant_audit_flood_suppressed_total |
(kind) |
sievant_header_mismatches_total |
header (Mcp-Param-* grouped) |
sievant_auth_failures_total |
reason (missing_credentials, invalid_credentials, expired, not_yet_valid, untrusted_certificate, unknown_identity) |
sievant_injection_suspected_total |
action (flag, annotate, block), signal |
sievant_injection_detector_errors_total |
outcome (block, pass) |
sievant_telemetry_refused_total |
class (syntax, metric, label, function, aggregation, modifier, range, step, points, stream, filter) |
sievant_raw_sql_refused_total (full build) |
class (encoding, syntax, multiple_statements, statement_type, comment, catalog, table, column, sensitive_column, function, operator, construct) |
sievant_inflight_requests, sievant_inflight_requests_peak, sievant_queued_requests |
|
sievant_db_pool_{open,in_use,idle,max_open}_connections, sievant_db_pool_wait_count_total, sievant_db_pool_wait_seconds_total |
connector |
go_goroutines, go_gc_duration_seconds, process_resident_memory_bytes, and the rest of the Go and process collectors |
Dashboard
An observability dashboard is served by the same binary on its own listener, with its own sign-in. It is off unless configured:
dashboard:
  listen_addr: 127.0.0.1:9090   # default; any non-loopback address requires tls
  auth:
    mode: token                 # token (default) | oidc
    token_sha256: <sievant hash-key < admin.token>
  # tls: {cert_file: ..., key_file: ...}
  event_interval: 250ms         # live stream coalescing window
Sign-in. Every route needs a signed-in operator; without one it answers
401 (the sign-in page for browser pages, JSON for the API and the event
stream). Tested over every route, with no credentials, a wrong bearer token
and a forged session cookie.
token: the admin token is configured as its SHA-256 digest (token_sha256, fromsievant hash-key, which refuses tokens under 32 bytes) or astoken: ${VAR}from the environment, which must be at least 32 bytes (a config error otherwise) and is kept only as a digest. A presented token under 32 bytes is never accepted. The sign-in form compares in constant time and starts a server-side session: a random 256-bit ID in anHttpOnly,SameSite=Strictcookie (Securewith TLS). Sessions end at an absolute expiry (session_ttl, default 12h, counted from sign-in, not extended by use); sign-out deletes the session server-side, so the old cookie gets401. Scripts may send the token asAuthorization: Bearer. Failed attempts are rate limited per client address (a burst of 5, then one a second).oidc: authorization code flow with PKCE (S256) against the issuer’s discovery document; the ID token must be RS256/ES256 from the issuer’s JWKS, for this client, unexpired, with this login’s nonce, and name anallowed_subjectsentry or a verifiedallowed_emailsentry. The state is single-use and expires after 10 minutes; starting a sign-in is rate limited per client address, and at the cap of 1,024 pending sign-ins the oldest is evicted, so new logins are never refused (tested: 5,000 starts from one address do not stop a login from another). Only/auth/oidc/start(a redirect to the IdP) is reachable signed out.
Every state-changing request (any method but GET, HEAD and OPTIONS) is
refused with 403 before authentication if it carries Origin: null, a
Sec-Fetch-Site other than same-origin, or an Origin naming another
host. A request carrying the session cookie, and the sign-in form, must
also prove it is same-origin: with neither Origin nor Sec-Fetch-Site
it gets 403, since the browser attaches the cookie by itself. A script
authenticated only by Authorization: Bearer (no session cookie) needs
neither header: a cross-site page cannot attach that header without a CORS
preflight, which the dashboard never grants. Every
response carries a strict CSP (script-src 'self'; style-src 'self', no
inline code), frame-ancestors 'none', nosniff and Cache-Control: no-store (hashed assets excepted).
Data. The dashboard reads the audit store (paginated history, newest
first) and in-process counters. It never proxies the unauthenticated
/metrics listener (and may not share its address).
Live stream. /events is an SSE stream of audit records and topology
changes. The audit tap aggregates every record in O(1) (one mutex, counters
updated in place) and samples at most max_event_records (default 50)
records and security events per window, uniformly (reservoir sampling). Once
per event_interval the window becomes one batch (counts per agent, tool and
status; the samples; node states when they change; a saturation sample every
second), marshalled once and offered to every stream without waiting: a slow
tab loses batches (reported to it as lag) instead of slowing the gateway.
At most max_streams (default 16) streams.
Views
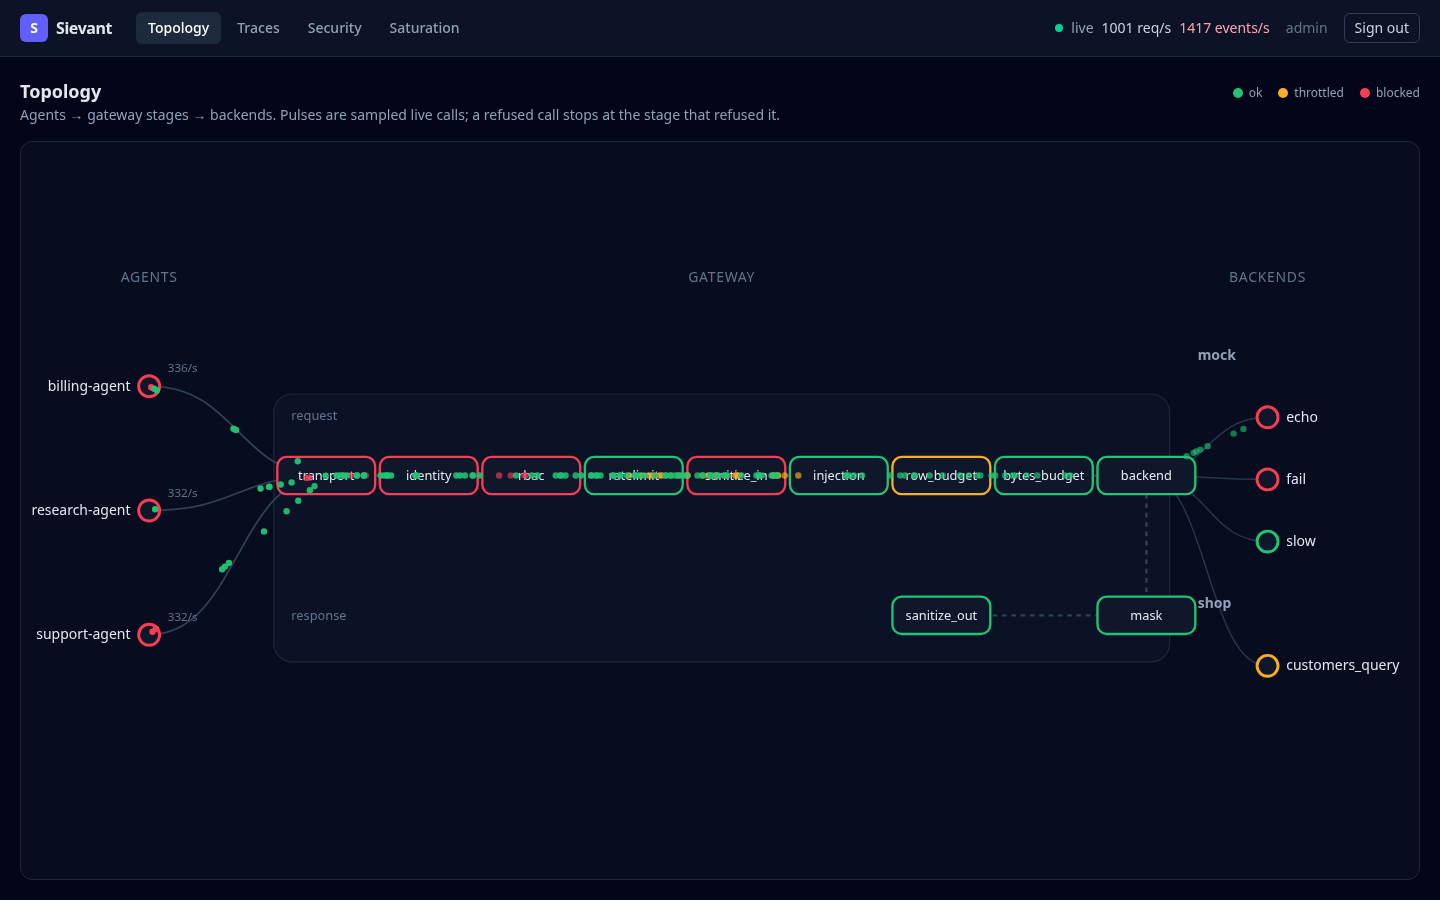
Topology. Agents → gateway stages (request lane, then the response lane) → backends grouped by connector. Pulses are sampled live calls; a refused call stops at the stage that refused it (red: denied or blocked, amber: throttled). Node colors show the last 10 seconds: blocked (denials, blocks, header mismatches, auth failures), throttled (rate limits, busy, row budget, backend timeouts) or ok.
Traces. Live or paginated calls; the per-stage waterfall of the selected
call (each bar is the stage’s own time, from the record’s spans); p50/p90/p99 per
tool over the rolling window.
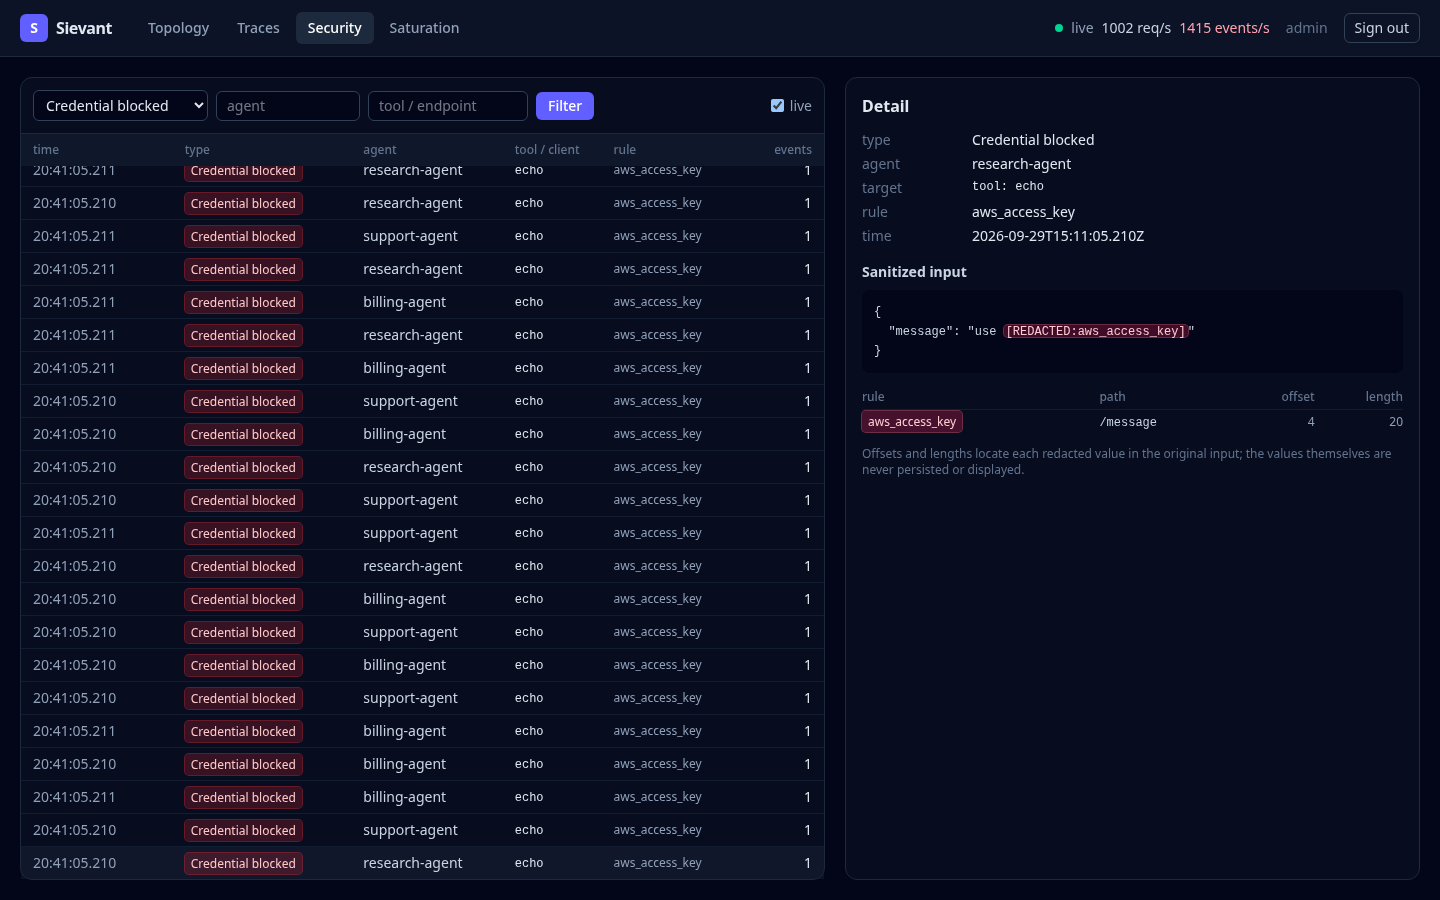
Security. Policy denials, argument-constraint violations, credential and PII blocks, row-budget exhaustion, output redactions, header mismatches and authentication failures, filterable by type, agent and tool, with flood summaries. The redaction viewer renders the sanitized input with every redaction highlighted and lists the spans (path, rule, offset, length) that locate the removed values: raw values are never stored, so they cannot be shown.
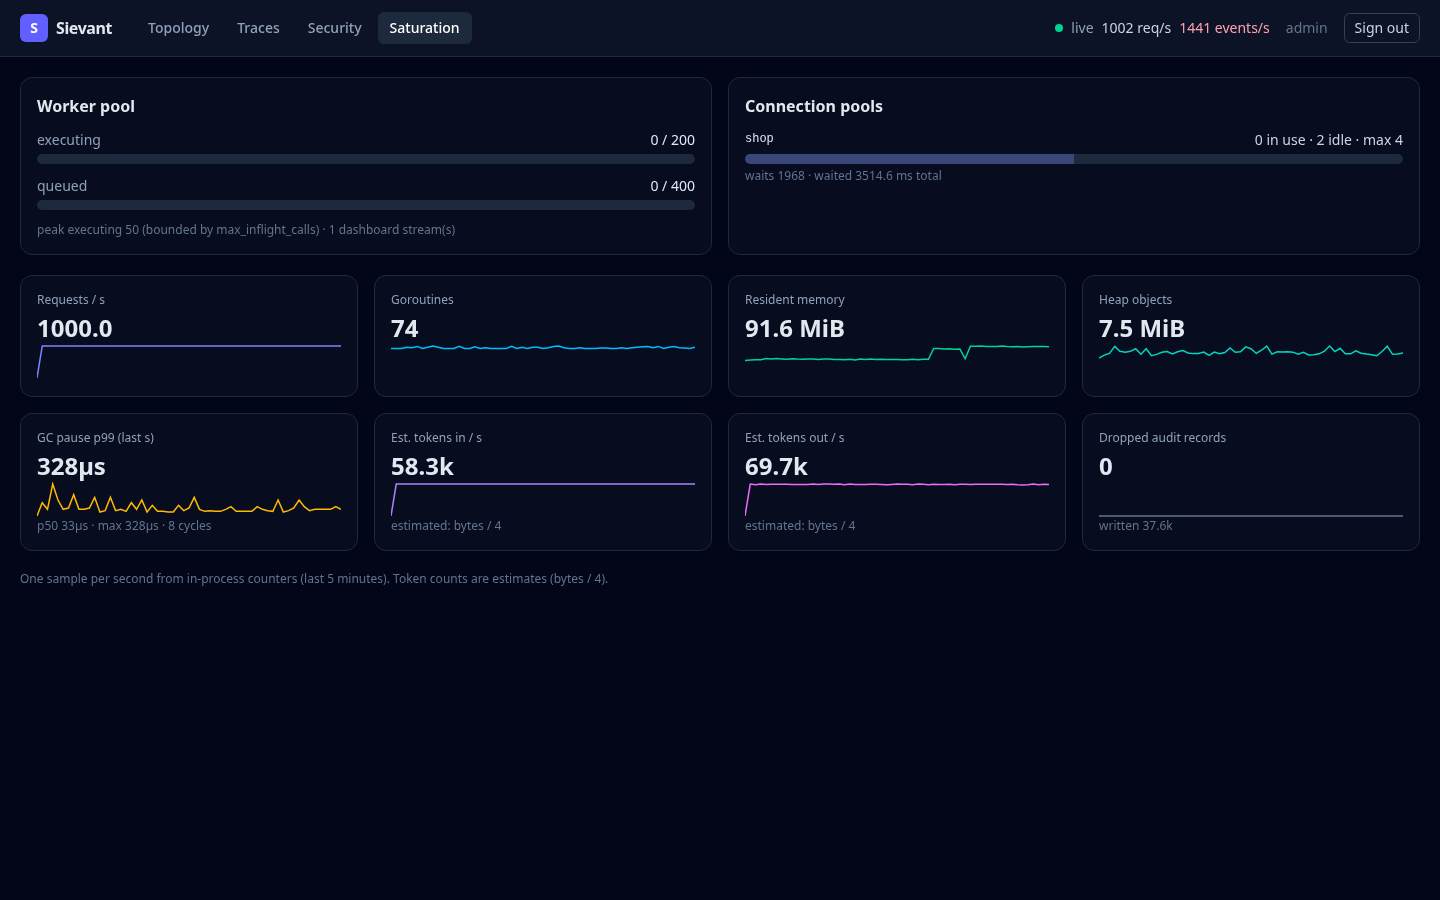
Saturation. Worker pool (executing and queued against their limits,
peak), connection pools per connector, goroutines, GC pauses (p50/p99/max
per second, from runtime/metrics), RSS, heap, dropped audit records,
requests per second and estimated token flow (bytes / 4), with 5-minute
history.
Performance at 1,000 calls/s
make ui-perf runs the release binary with the HTTP transport, a SQLite
connector and the dashboard, drives about 1,000 calls/s of mixed traffic
(allowed calls with personal data, slow calls, denials, unknown tools,
credential blocks, header mismatches, bad API keys, row-budget exhaustion:
about 1,450 security events/s), and opens the dashboard in headless Chromium
(1440×900) through ui/perf/measure.mjs. On each view it records every
requestAnimationFrame interval and every long task (PerformanceObserver,
main-thread work over 50ms), clicks a row every second and times click to
the next painted frame, and reads the JS heap. It fails on a long task over
200ms, a frame over 500ms, under 30 fps or any console error. Measured
with make screenshots (999 calls/s for 70s, 15s per view; load generator,
server and browser on one laptop, Ryzen 7 6800H):
| View | fps | frame p99 / max | frames > 50ms | long tasks | click → paint p50 / max | JS heap |
|---|---|---|---|---|---|---|
| Topology | 60.3 | 16.8 / 16.8ms | 0 | 0 | – | 5.8 → 12.1 MB |
| Traces | 62.3 | 16.8 / 16.8ms | 0 | 0 | 28 / 31ms | 4.8 → 5.6 MB |
| Security | 62.5 | 16.8 / 16.8ms | 0 | 0 | 28 / 48ms | 5.6 → 4.9 MB |
| Saturation | 60.3 | 16.8 / 16.8ms | 0 | 0 | – | 6.3 → 8.9 MB |
The UI keeps a bounded amount of state (200 recent calls, 200 security
events, 300 saturation samples), replaces arrays once per batch instead of
mutating reactive state per record, and draws pulses on a canvas in one
requestAnimationFrame loop (at most 180 in flight).
Size. The embedded UI is 107 KB (JS 80 KB, CSS 27 KB; 34 KB gzipped) and adds 108 KiB to the binary.
From the Sievant repository: docs/audit.md at commit 8529db1.